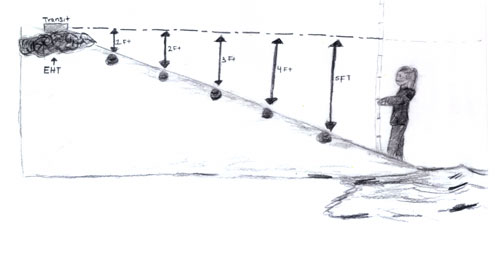
How to collect data to show the profile of a slope
Processing your data: Use graph paper to represent the slope change with distance. Draw to scale. The x axis should be the total length of your profile. The y axis should show the vertical drop distance.
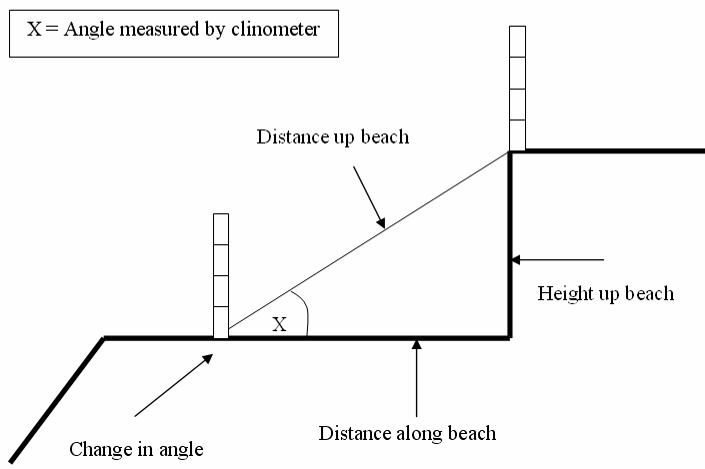
Or you could use a protractor like this system:
- To do this use two rulers and a measuring tape. Place the rulers at right angles to the surface at each of the end of 1m intervals along the tape measure, starting at the lowest or the highest point. Hold the tape horizontally (if possible use a spirit level to ensure this) and measure the height difference between the two rulers.
- Repeat this up or down the slope noting the change in height. Remember the slopes can decrease (in crevices, pools) as well as increase in height between stations, but overall the height should continue increasing up a slope.
Processing your data: Use graph paper to represent the slope change with distance. Draw to scale. The x axis should be the total length of your profile. The y axis should show the vertical drop distance.
Or you could use a protractor like this system:
|
|
